

Layers
Toggle departments, stations, jurisdictions, incidents, and FEMA / NRI overlays, then refine the visible map with filters and ranges.
Transform raw public records into actionable metrics.

Analyze the lifecycle of emergency calls.
See how demand changes over time.
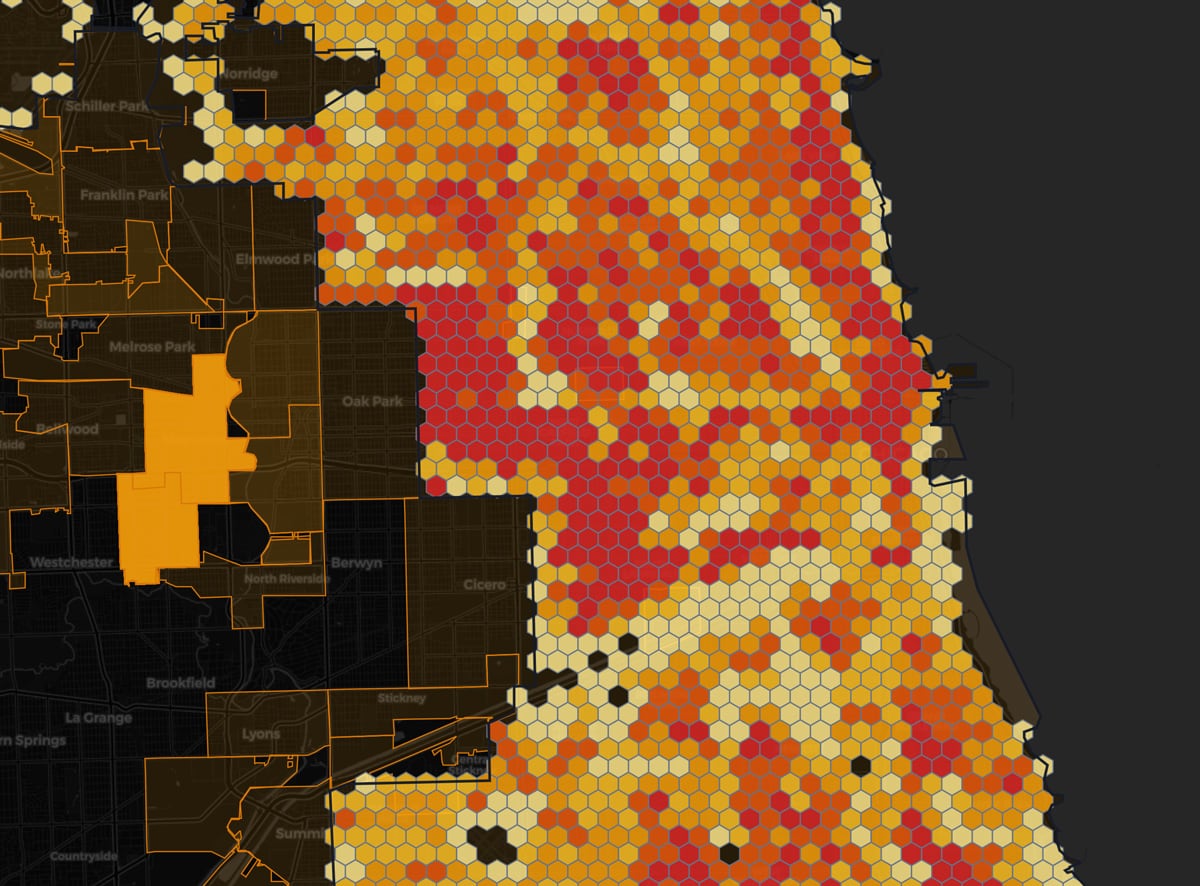
Visualize where incidents are happening.
Don't just look at the averages. Our dashboard allows you to slice the data to find specific insights relevant to your needs.
Isolate Fire vs. EMS calls, or drill down into specific call types.
Analyze a specific month, year, or a custom historical range.

Explore interactive fire department jurisdictions, department points, station locations, incident layers, live weather, and FEMA / NRI context in one workspace. Start with layers, refine with filters, then move into polygon summaries, hexplots, and analysis.
Portal login unlocks AI, predictive analytics, and planner workflows in the full map experience.
Toggle departments, stations, jurisdictions, incidents, and FEMA / NRI overlays, then refine the visible map with filters and ranges.
Draw a polygon to review summary metrics for the selected area and build filtered operational hexplots from the same geography.
Use AI, predictive analytics, and the planner to ask questions about a selected polygon and model jurisdiction impact after portal login.